This guide explains the core layout, key components, and operational workflows of the Home Overview page — the default landing page of the unified web management console for both USB Disk Security (Standard Edition) and PrivateDLP (Pro Edition). It covers the full structure of the device list, real-time status indicators, security alert tracking, and the per-device policy configuration panel accessed via the Details button. This document helps administrators quickly gain full visibility into all deployed endpoints, monitor security status at a glance, and perform granular single-device configurations without navigating across multiple modules.
Introduction
The Home Overview page is the primary administrative dashboard that loads immediately after you sign into the web console. As the central hub for endpoint visibility, it consolidates real-time connectivity status, subscription license status, and security alert records for all bound Windows endpoints in a single structured list. It eliminates the need to navigate between separate modules for routine monitoring and basic device management, streamlining daily security administration workflows for teams of all sizes.
Page Layout Overview
The home page follows a standard two-panel enterprise dashboard layout:
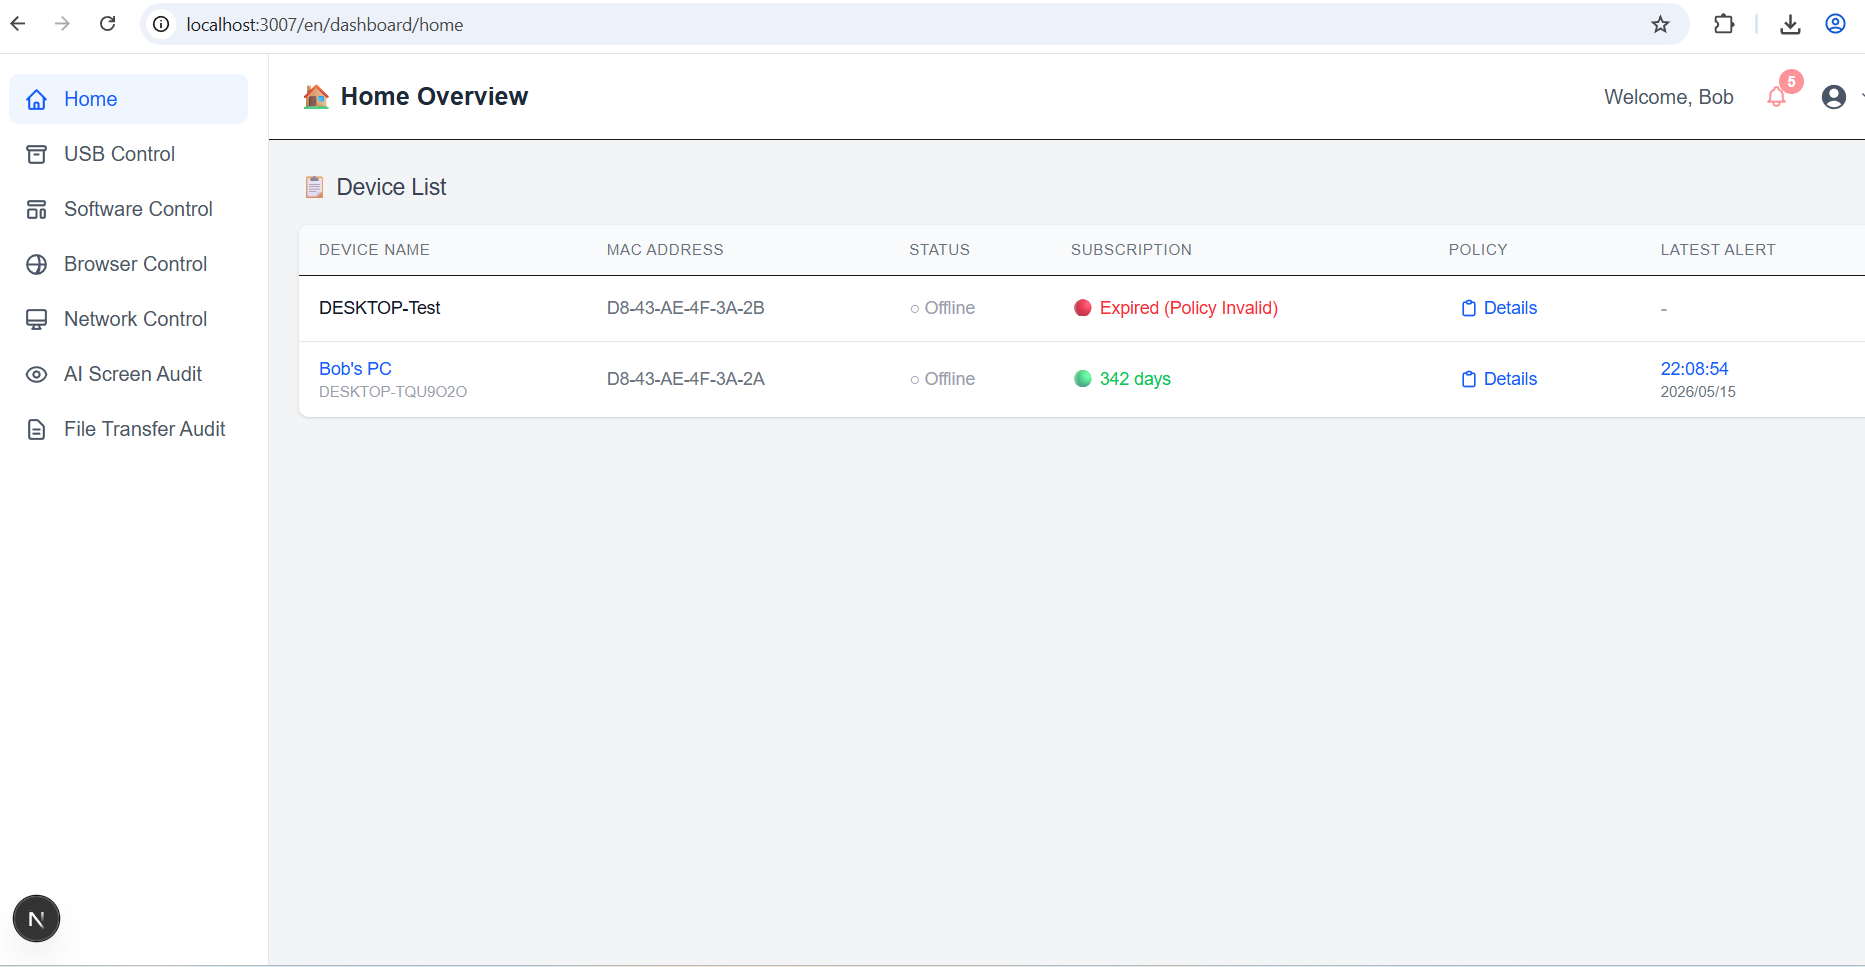
Left Navigation Bar: Provides one-click access to all core functional modules, including Home, USB Control, Software Control, Browser Control, and Network Control. For PrivateDLP Pro subscribers, additional modules for AI Screen Audit and File Transfer Audit are also listed. The Home module is selected by default on login.
Main Content Area: Displays the Device List, the core functional component of the home page.
Top-Right Corner: Shows the administrator welcome message, in-app notification center, and account profile menu.
Core Component: The Device List
The Device List is the central element of the Home Overview page, displaying every endpoint client bound to your organization’s admin console with standardized status metrics. Each row represents one deployed Windows device, with the following columns:
Device Name
The display label of the endpoint. Administrators can set a custom recognizable alias (such as an employee name, department, or device location) which appears as the primary label; the device’s native system hostname is shown below the alias in smaller secondary text.
MAC Address
The unique physical MAC address of the endpoint’s network adapter, serving as the fixed, immutable identifier for the device across the entire system.
Status
Indicates the real-time connectivity state of the client device, updated via regular heartbeat checks. Devices are marked as Online or Offline to help administrators quickly identify disconnected or unresponsive endpoints.
Subscription
Shows the active license status of the device:
Active: Displays the number of remaining valid subscription days, with all configured security policies fully enforced.
Expired: Marked with a "Policy Invalid" note, meaning all security rules stop taking effect once the subscription lapses.
Policy
Contains a Details button for each device. Clicking this button opens the dedicated per-device Policy Configuration Overview panel for status review and targeted configuration edits.
Latest Alert
Shows the timestamp of the most recent security alert triggered on the device, including USB virus detections, policy breach events, and (for PrivateDLP Pro) AI audit violation events. A dash (-) is displayed if no alerts have been recorded for the device.
Device Details & Policy Configuration Panel
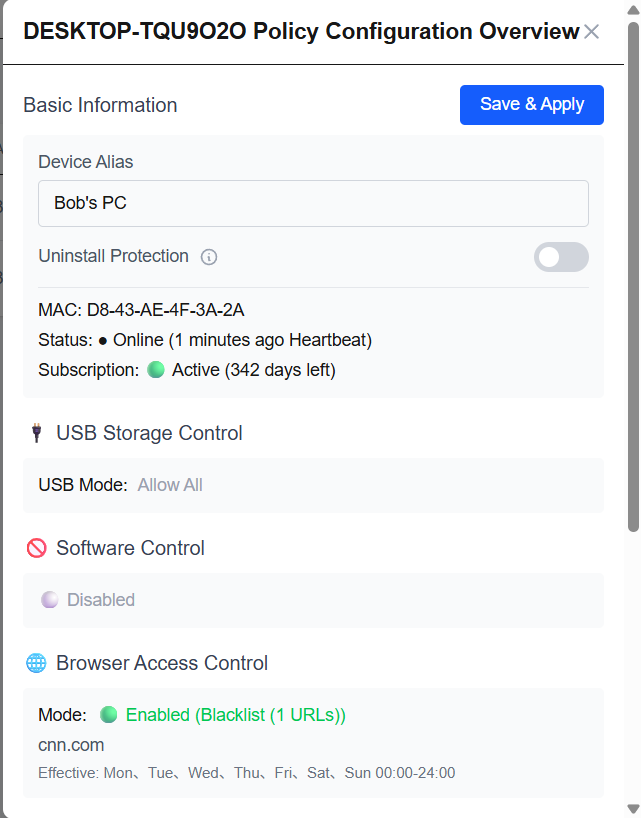
Clicking the Details button for any device opens a pop-up panel titled [Device Name] Policy Configuration Overview, which consolidates all basic device information and current policy settings for that specific endpoint. This panel supports both at-a-glance status review and direct configuration adjustments.
Basic Information Section
This top section displays core device attributes and supports foundational administrative settings:
Device Alias: An editable text field where administrators can rename the device to a custom, human-readable label for simplified fleet management.
Uninstall Protection: A toggle switch that enables or disables client uninstall protection. When activated, end users cannot remove the endpoint client without administrator authorization, ensuring persistent security policy enforcement.
Static Status Metadata: Below the configurable settings, the panel displays the device’s fixed MAC address, real-time online status with the latest heartbeat timestamp, and current subscription validity period for quick reference.
Policy Status Overview
Below the basic information section, the panel provides a consolidated, scrollable view of all active security policies applied to the device, eliminating the need to navigate to individual function modules for status checks. Core policy categories include:
USB Storage Control: Shows the current USB access mode (such as Allow All, Block All, or write-only restriction mode).
Software Control: Indicates whether application launch blocking rules are enabled or disabled.
Browser Access Control: Displays the current control mode (whitelist or blacklist), the number of configured URL rules, and the full effective time window for the policy.
Save & Apply Action
All modifications to the device alias, uninstall protection setting, or policy configurations take effect only after clicking the Save & Apply button in the top-right corner of the panel. Once saved, updated policies are automatically pushed to the target endpoint and take effect in real time.
Key Use Cases & Operational Value
Global Endpoint Health Auditing
Administrators can scan their full device fleet in seconds to identify offline devices, expired subscriptions, and devices with recent security alerts, enabling proactive security maintenance and license management.
Rapid Incident Response
The Latest Alert column lets security teams immediately spot devices with active security events. With one click on Details, administrators can verify policy configurations, adjust rules, and remediate risks without multi-page navigation.
Granular Per-Device Management
For special-use endpoints or individual team members, administrators can quickly set custom aliases, enforce uninstall protection, and validate policy settings directly from the home page, supporting targeted security governance at scale.
Summary
The Home Overview dashboard is the foundational entry point for daily endpoint security administration. By centralizing device status tracking, subscription management, alert visibility, and single-device configuration in one intuitive interface, it reduces administrative overhead and helps teams maintain consistent, real-time oversight of all endpoint security postures across the organization.