This user guide introduces the data viewing, statistical analysis, and report query functions of PrivateDLP AI Screen Audit. It focuses on how administrators can view real-time and historical terminal activity data via the View Details entry, interpret working time, leisure time, and offline time metrics, and analyze long-term employee office behavior trends. The visualized report data helps enterprises quantify employee productivity, identify abnormal office behaviors, and support refined internal management and data security supervision.
1. Overview
PrivateDLP AI Screen Audit automatically collects, analyzes, and counts employee terminal behavior data based on LLM screen recognition results. The system generates intuitive visualized statistical reports, covering daily and multi-month working status distribution.
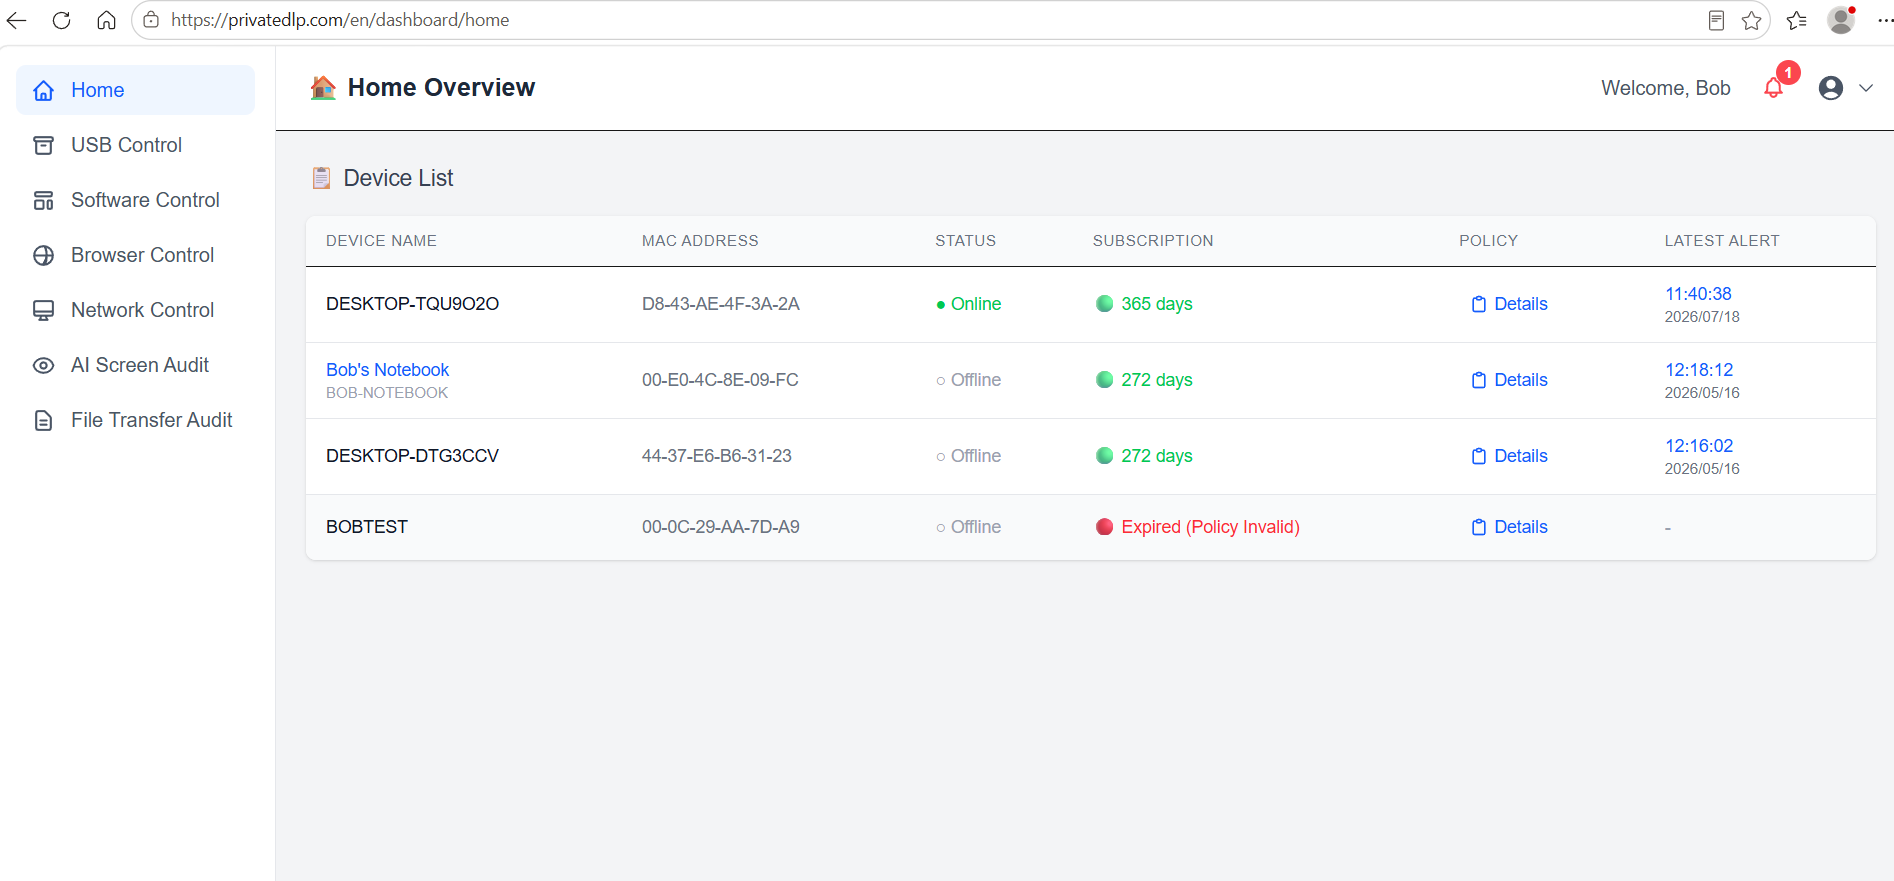
Different from traditional single data logs, this report module integrates automatic classification of full-day terminal behaviors. Administrators can quickly enter the detailed data dashboard through the View Details button of each device, independently check the activity status of a single terminal, and realize precise personnel efficiency management and risk traceability.
2. Preconditions
The terminal has enabled the AI Screen Audit function and completed rule configuration.
The Windows client is online and normally reports AI analysis data.
Administrator account has device data viewing and report query permissions.
3. Enter Report Details via View Details
3.1 Access Entry
Log in to the PrivateDLP web management backend and enter the device list page. Each monitored terminal device corresponds to a dedicated View Details button. Click this button to jump to the independent AI activity statistical report page of the target device, which displays complete daily and historical behavior data of the employee’s computer.
3.2 Page Function Description
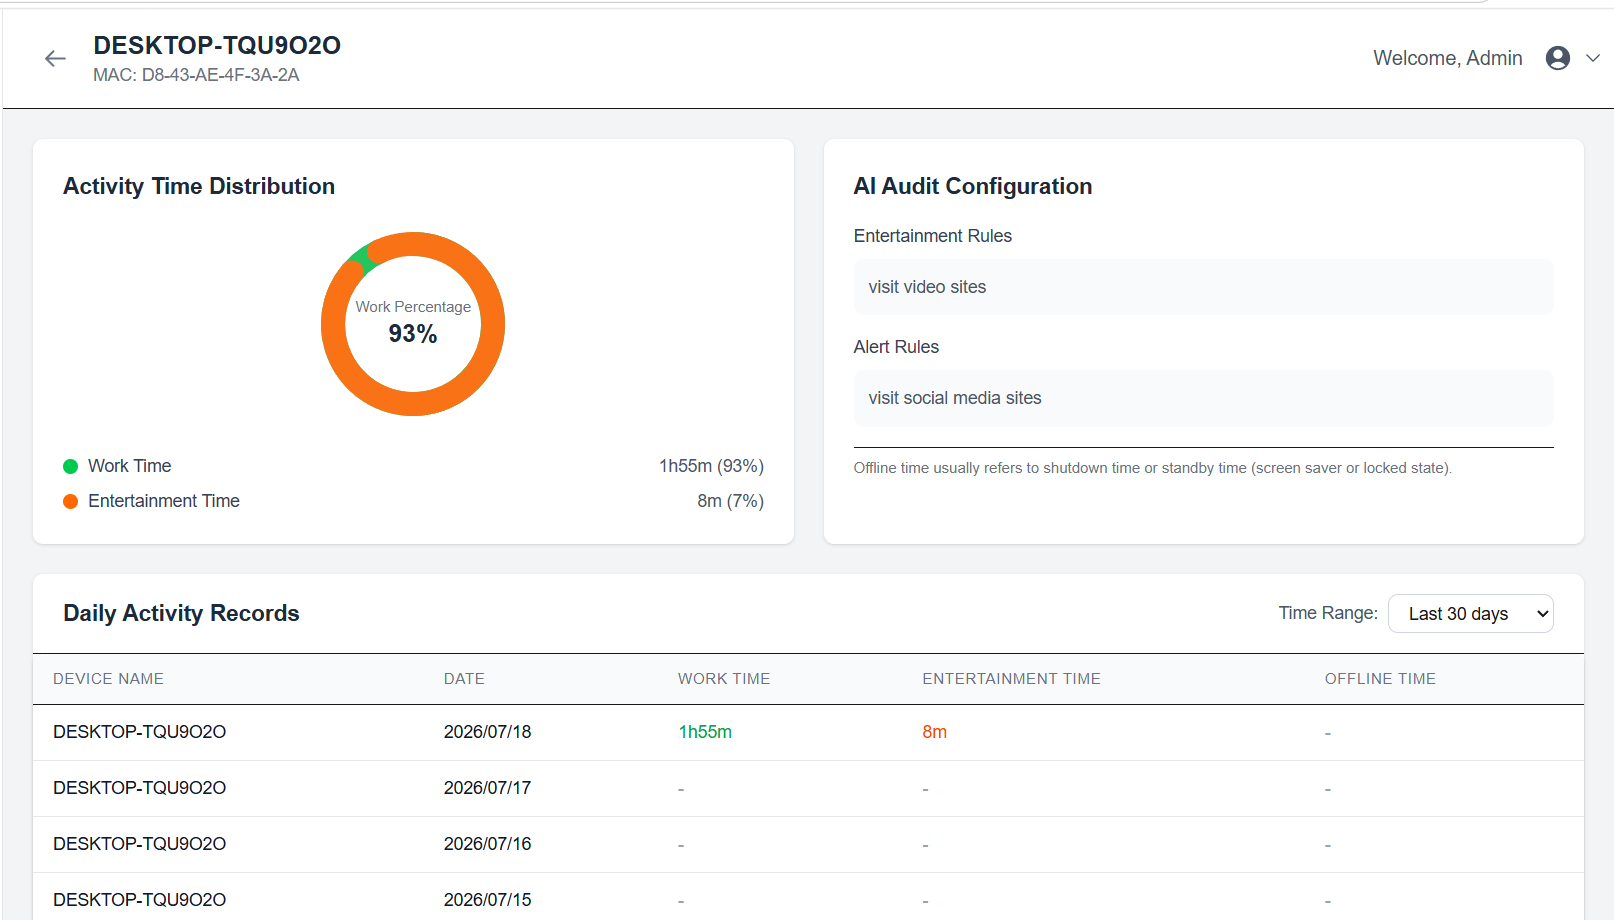
The detail page is a dedicated data dashboard for a single device, including real-time daily activity proportion charts, historical trend statistics, and time dimension breakdown data. It supports exclusive data viewing for individual terminals to avoid data confusion among multiple employees.
4. Core Statistical Metrics Definition
All data statistics are generated based on AI screen audit recognition results. The system divides all terminal running status into three core dimensions, with clear and unified judgment standards:
Working Time: Valid office duration identified by LLM. All screen behaviors that are not defined as leisure behaviors are automatically counted as working time, including operating business systems, viewing work documents, communicating work content, and running office software.
Leisure Time: Non-working non-work behaviors defined by administrators through natural language rules, such as browsing non-work websites, running game software, shopping online, and viewing social platforms.
Offline Time: Terminal inactive status, including computer shutdown, screen lock, sleep mode, network disconnection, client offline, and other non-operating scenarios.
5. Daily & Multi-Month Data Query Operation
5.1 Daily Data Viewing
After entering the View Details dashboard, the page defaults to displaying the current day’s activity statistics. Administrators can intuitively view the real-time proportion of working, leisure, and offline time, and grasp the employee’s daily office focus and abnormal non-work behaviors in real time.
5.2 Long-Term Historical Data Statistics
The system supports multi-month continuous data statistics, which is the core advantage of productivity analysis. Administrators can select any historical time period to view daily data records, generate long-term behavior trend curves, and analyze the stability of employee work efficiency and regular abnormal behaviors.
5.3 Batch Device Data Comparison
Administrators can enter the View Details page of different devices in turn to compare the working time proportion of team members, realize horizontal team efficiency evaluation, and provide data support for team management optimization.
6. Report Data Application Scenarios
Employee Productivity Evaluation: Judge employee work investment status through the proportion of long-term working time, and accurately identify low-efficiency office behaviors caused by frequent non-work operations.
Abnormal Behavior Traceability: Combine time distribution data with AI alert records to locate the time node of risky behaviors and realize closed-loop security management.
Enterprise Rule Optimization: According to the overall leisure time distribution of the team, dynamically adjust natural language audit rules to make management standards more in line with actual office scenarios.
7. Data Update & Synchronization Mechanism
Real-Time Analysis: The client captures screenshots every 1 minute for AI analysis, and the statistical data is updated synchronously in real time.
Data Accumulation: Daily valid data is automatically archived, and long-term historical data will not be automatically cleared, supporting permanent traceability query.
Offline Data Compensation: When the terminal is offline, the system automatically records offline time. After re-online, the data will be automatically synchronized to the backend report without data loss.
8. Data Privacy & Security Protection
The statistical report only stores structured time data and behavior labels. All original screenshots used for AI analysis are automatically deleted immediately after recognition, and no screen content data is retained. Only violation alert screenshots are stored as audit evidence. All report data is encrypted and stored, and only authorized administrators have viewing and query permissions to ensure employee privacy and enterprise data security.